
Keyword
Global / Oceans | Pacific Ocean
221 record(s)
Type of resources
Topics
Keywords
Contact for the resource
Provided by
Formats
Update frequencies
Status
draft
-
This dataset contains data collected by the Australian Continuous Plankton Recorder (AusCPR) survey and is funded by IMOS (Ships of Opportunity sub-facility) and CSIRO. The aims of the AusCPR survey are to: * map plankton biodiversity and distribution * develop the first long-term plankton baseline for Australian waters * document plankton changes in response to climate change * provide indices for fisheries management * detect harmful algal blooms * validate satellite remote sensing * initialise and test ecosystem models. The survey conducts repeat tows in the GBR, the East Australian Current and down to the Southern Ocean Time Series Mooring (SOTS). Other routes are conducted on an adhoc nature around Australia. The dataset also contains phytoplankton data from the UTAS / AAD led Southern Ocean CPR (SOCPR) project which is also funded by IMOS. The datasets available in this collection include Phytoplankton Colour Index (an estimate of chlorophyll in the water), phytoplankton abundance, zooplankton abundance and a biomass index from AusCPR and phytoplankton abundance from SOCPR. This data are freely available through the AODN portal: https://portal.aodn.org.au. This data is freely available but please acknowledge all relevant parties, as detailed in acknowledgement section.
-
This dataset comprises the phytoplankton abundance and biovolume estimates as part of a broader sampling program carried out at the Southern Ocean Time Series, a facility within the Integrated Marine Observing System (IMOS). The primary focus is sustained observing of ocean properties and processes important to climate, carbon cycling, and ocean productivity. Regular phytoplankton samples are collected at approximately 14 day intervals (exact intervals and seasonal coverage dependent on deployment length). The moorings are serviced annually, at which time the existing moorings are recovered and new moorings are deployed. Water samples from within the surface mixed-layer are collected at pre-programmed intervals using a Remote Access Sampler, in pairs about 1 hour apart. One sample in each pair is preserved for phytoplankton community composition by microscopy, and the other sample is preserved and used for accompanying chemical analysis of nutrients, total dissolved inorganic carbon (DIC) and alkalinity. Each sample is collected from within the surface mixed-layer at 32 m depth (2010 - 2017) or 5 m depth (2018-current) depending on the design of the mooring surface assembly and instrumentation. Typically a maximum of 24 samples are collected over an annual deployment cycle. The samples collected are analysed for: 1. Community composition / abundance (cells/L) 2. calculated biovolume (um3/L). Protocols for the phytoplankton time-series are described in Eriksen et al (2018), and the annual sample reports for each deployment. Data storage and access is planned to be interoperable with other national and international programs through the IMOS Infrastructure. Station metadata can be found through this resource. Data is available freely via the AODN portal: https://portal.aodn.org.au. As the taxonomic resolution of the data has changed over time, due to continual training, it is important that users refer to the change log tables included in your data download. These will provide information on the validity of the taxa, from what date we have been identifying certain taxa etc. Classification fields may be blank depending on the level to which that taxa has been identified, i.e. if only identified to family, genus and species will be blank.
-
The CSIRO versions of the BOM (Bureau of Meteorology Australia) ocean variables temperature and 20 degree isothermal temperature depth datasets for the region covering the Pacific to the Indian ocean. Individual monthly temperature and 20° isothermal temperature depth datasets have been concatenated into single contiguous netcdf files for the time period 1980-2008 with a spatial resolution of 1° x 2° at 14 levels from 0-500m. These have also been processed to include calculated Anomaly, Climatology, and Seasonal forms, approximately 8 files totaling 475.7 MB.
-
Information relating to Australian fisheries closures imposed by AFMA (Australian Fisheries Management Authority) and gazetted through ComLaw have been collated and tabulated with mapable GIS references in an ORACLE data base. This database allows searching, viewing and GIS mapping of the Australian spatial fisheries management through time. Mapping views of fisheries closures can be created for time, fisheries and gear types. Changes in spatial management through time will be mapable using a time-series of mapping views. The data is currently complete for the time-period of 2005 to Feb 2013. It is intended to continue this records as new gazettes are released as part of annual stock assessment updates. Non-fisheries closures (MPA, CMR) are also intended to be included but this is dependent on continued funding and demand for their use. Disclaimer: These data have been collated and made accessible for scientific research only, they may not be complete or representing the most up-to-date data. For the most recent spatial management arrangements for legal and commercial purposes, refer to the relevant current ComLaw documents or contact AFMA.
-
CSIRO holds hard copies of longline data (in Japanese) from two Fisheries High Schools: Misaki Fisheries High School, 1969–2000; Shonan Maru (570 pp). Sakai Fishery High School, 1969–1997; Wakatori Maru (324 pp). These reports were provided by the Tokyo University of Fisheries library, where they appear under the titles Josen Jisshu Hokokusho Shonan Maru and Josen Jisshu Hokokusho Wakatori Maru in OPAC. The information contained in these reports relates to the operation of tuna longlines, and includes fishing effort, oceanography and catch composition, and is reported by individual set. Shark are reported only as a general category in both these data sets. The Shonan Maru appeared to make several voyages each year of 1–2 months duration. Examples of translation sheets are included with the hard copies.
-
Sea surface temperature data (daily and weekly composites) from NOAA Advanced Very High Resolution Radiometer (AVHRR) data received at the Hobart station and processed at CSIRO Marine Research Remote Sensing Facility. The images cover an area from 21.3 to 50.0 degrees South, 130.3 to 167.0 East. The images correspond to the regions and time periods of Southern Surveyor research voyages SS 01/95, SS 11/95, SS 05/96 and SS 11/96, in south-eastern and east Australian waters. The data are contained on CDROM in Hobart, and copies are sent to GRNS (and others?). The Global Research Network System (GRNS) project was carried out between 1993-1997 sponsored by the Japanese Science and Technology Agency (STA).
-
This data set is the laboratory analysis of Lipids, fatty acids and sterols of numerous species of marine animals from the Tasman Sea, Pacific and Southern Ocean, collected between 1986 and 2008. Some portions of the data collection and analysis are still ongoing.
-
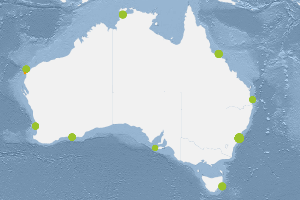
This dataset describes the Data Quality Control Flags and Descriptions used by the Integrated Marine Observing System (IMOS) National Reference Station sampling sites. Nine Sites are included in the IMOS NRS field sampling stations. Maria Island (TAS), Kangaroo Island (SA), Esperance (WA), Rottnest Island (WA), Ningaloo (WA), Darwin (NT), Yongala (QLD), North Stradbroke Island (QLD) and Port Hacking 100 (NSW). Sampling at these sites is conducted by several members of IMOS NRS Biogeochemical project. Sampling at the sites began between 29/9/2008 and 8/11/2010 and is currently ongoing for 7 sites. Sampling ceased at Ningaloo and Esperance (WA) sites in Aug/Sept 2013. Sampling is conducted monthly (Esperance and Ningaloo were 3 monthly) off small vessels. Depths sampled range from surface to 105 metres depending on the site. Depths are usually sampled at 10 metre intervals. Details including information on station locations, depths sampled and sample types collected are shown in the PDF link below extracted from the IMOS NRS NATIONAL REFERENCE STATIONS BIOGEOCHEMICAL OPERATIONS - A PRACTICAL HANDBOOK, Version 2.2 July 2012. A link to the full handbook is also provided which includes full details of the sampling regime and analyses. Historical data collected as part of CSIRO Coastal Monitoring program is available for three of the National Reference Station sites: Maria Island Coastal Station Data 1944-2008, Port Hacking 100m Coastal Station Data 1953-2010 and Rottnest Island Coastal Station Data 1951-2009. The links to the metadata and access for these data is provided below. Data storage and access is planned to be interoperable with other national and international programs through the IMOS Infrastructure. Station metadata can be found through this resource. Data is freely available through the AODN portal: https://portal.aodn.org.au
-
This record describes multibeam echosounder data collected on the RV Investigator voyage IN2016_V03, 'Monitoring Ocean Change and Variability along 170° W from the ice edge to the equator', which departed Hobart on the 26 April 2016 and returned to Lautoka, Fiji on the 30 June 2016. There was a port call at Wellington, New Zealand, 26 - 27 May for some science personnel change; this resulted in two "legs" of the voyage therefore Leg 1 is 26 April - 26 May 2016, and Leg 2 27 May - 30 June 2016. The Kongsberg EM710 MKII multibeam echosounder was used to acquire seafloor bathymetry and backscatter information. The EM710 provides a 0.5° by 1° transmit and receive angular resolution respectively. The echosounder's nominal frequency range is from 40 to 100 kHz. Data are stored in *.all raw format for bathymetry and backscatter at CSIRO. There are 46 files totalling 5.51 GB of raw data in this dataset. Sound velocity profiles were applied to this data during data acquisition. Bathymetry data contained in *.all format is corrected for motion and position. Tide corrections were not applied to the processed data. Processed data has had outliers removed. Processed line data is available in *.gsf and ascii format and processed bathymetry grids in geotiff format. Additional information regarding this dataset including further information on processing streams is contained in the GSM data acquisition and processing report. Additional data products may be available on request.
-
This record describes the datasets collected from the development of a Gene Tagging Tool for the Regional Tuna Tagging Programme (RTTP) which is managed under the auspices of the Indian Ocean Tuna Commission and genetic tagging studies. The aim is to quantify population structures and migratory dynamics which are currently poorly understood. The use of SNP markers lend themselves easily to routine and inexpensive ($10-$20 per fish) screening methodologies. The stock assessment advice is used to assist in the conservation and optimal economic use of this resource. This record describes the datasets collected or resulting from the outcome of the programme. Acronyms: ANSFAS: -Australia New Zealand Food Authority SNPs: -Single Nucleotide Polymorphisms IOTC: -Indian Ocean Tuna Commission RTTP: -Regional Tuna Tagging Programme FRDC: -Fisheries Research and Development Corporation